This site uses cookies to improve your experience. To help us insure we adhere to various privacy regulations, please select your country/region of residence. If you do not select a country, we will assume you are from the United States. Select your Cookie Settings or view our Privacy Policy and Terms of Use.
Cookie Settings
Cookies and similar technologies are used on this website for proper function of the website, for tracking performance analytics and for marketing purposes. We and some of our third-party providers may use cookie data for various purposes. Please review the cookie settings below and choose your preference.
Used for the proper function of the website
Used for monitoring website traffic and interactions
Cookie Settings
Cookies and similar technologies are used on this website for proper function of the website, for tracking performance analytics and for marketing purposes. We and some of our third-party providers may use cookie data for various purposes. Please review the cookie settings below and choose your preference.
Strictly Necessary: Used for the proper function of the website
Performance/Analytics: Used for monitoring website traffic and interactions
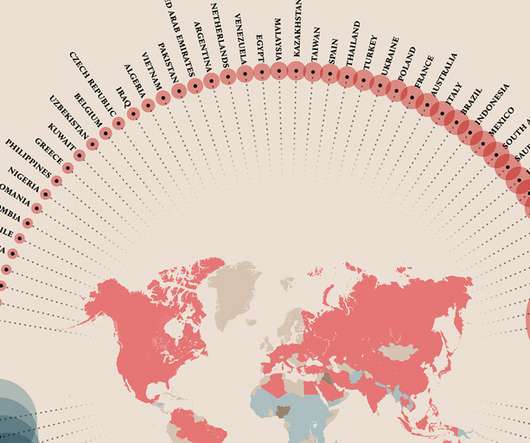
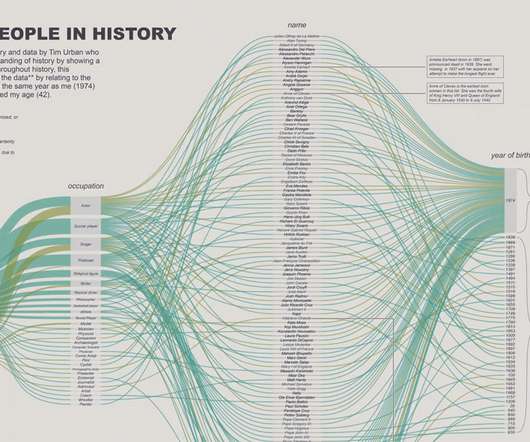
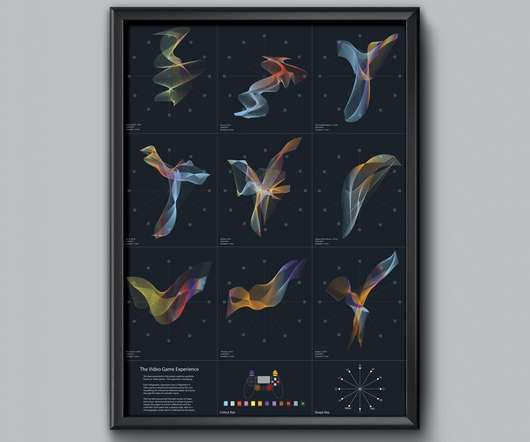
If you're interested in creating infographics, it's helpful to look at work from the design industry's standout performers. Linked below are ten stunning examples: data visualization rendered so creatively that it achieves the status of pure art. Save See the complete infographic here. Save See the complete infographic here.
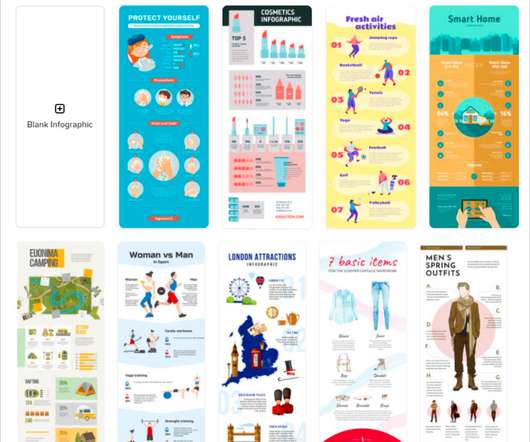
Infographics are one of the best ways to present data without making your audience yawn with boredom. There are a lot of people who have impressive data, but what they don’t know is how to create informative and well-designed infographics. Check out our list of over 40 infographic tools and create awesome infographics in no time.
With this highly recommended online course, you will learn how to transform information into art. In 14 lessons, she gives you all the tools you need to transform data into captivating infographics using colors, shapes, and images. Online Course: Data Visualization Using Infographics to Transform Information into Art.
From murals to infographics to caricatures, if you can create on the fly, there could be work in it for you. Her sister has learning difficulties, and Esther communicates with her through art. Let's meet four of the world's best live event illustrators. Esther honed her abilities at home as she grew up.
Its goal was to make the best use of Mexico's cultural wealth to promote economic growth and social development, working on two main challenges: firstly to protect Latin America's rich cultural heritage, and secondly to bring arts and culture into public education.
Top 10 Infographic Marketing Trends. “With infographic marketing, less is always more.” With all the innovative marketing trends hailing, infographic marketing keeps popping up regarding digital and content marketing. Immerse into Infographic Marketing – Experience Innovation. Source: Visme.
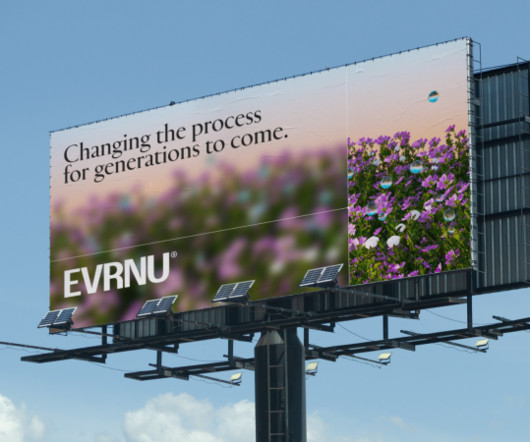
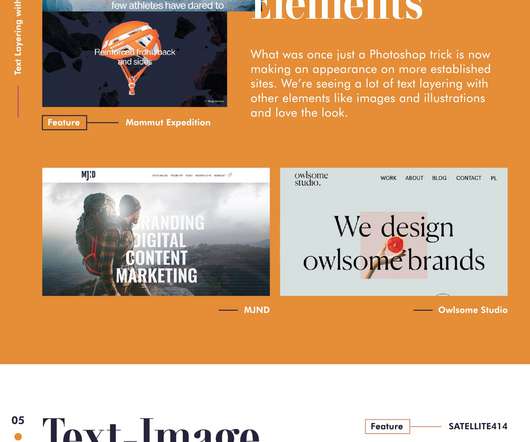
Meanwhile, animated infographics are on hand to demystify Evrnu and NuCycl's process, and parallax scrolling effects ensure user engagement as they navigate the site. The result is a hyper-realistic and futuristic aesthetic that brings passion, art, and science together," DEPT concludes. "It
In light of this trend, abstract art has gained momentum and ideas are getting represented in a graphic manner through modern designs. You can even go a step ahead and add personalized videos to your landing pages with the help of tools like Vidyard and Hippo Video. . Demonstrative illustrations. It is used for legal services.
Ultimate Guide to Infographics Design in Marketing Hey there! There's nothing quite like a well-designed infographic to convey information in a memorable and shareable format. However, creating effective infographics can be challenging. Infographic design is an art and a science! Let's get started!
Created during her final year at Berlin University of the Arts, she is now revisiting the project to support the people of Ukraine. "I Veronika graduated from The Belarusian State Academy of Arts in Minsk and later studied her undergraduate and postgraduate courses in graphic design in Germany.
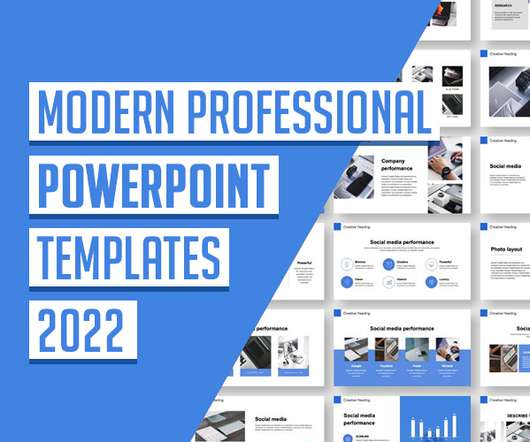
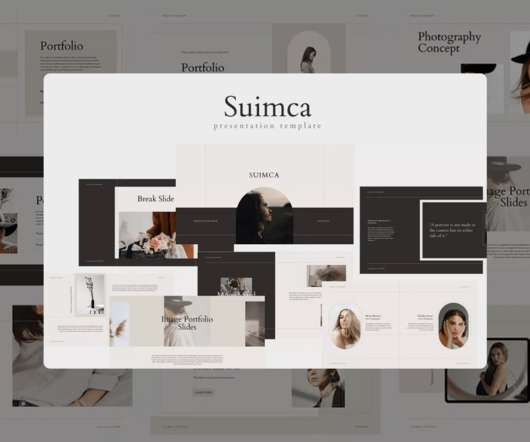
It is better to focus on a short infographic. By the way, with regards to infographics, you should initially look for professional PowerPoint templates that have blanks for statistics, graphs, and charts that are suitable for your field of activity. Art School Presentation: 50 Slides PPTX, KEY, Google Slides. Industry 4.0
System is a modernist, neo-Grotesk sans family influenced by wayfinding infographics in European and US art galleries. Designed by Nicolaas Kotzé of Studio Gummi, Flake is a modular display typeface that can be used to create art installations or sculptures out of words or letters pieced together. System by Frost.
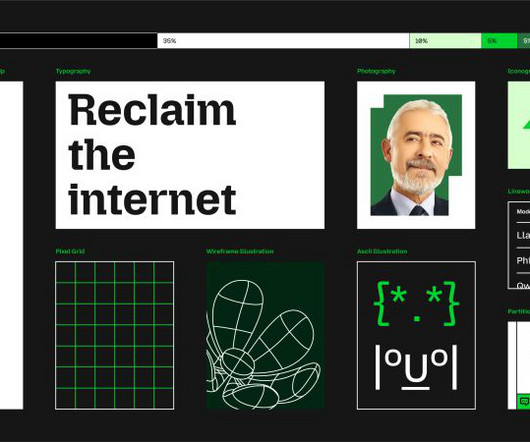
Bebbington describes it as "a symbol of belief, peace, unity, pride, celebration and team spirit" and explains how it can transform into "a more literal interpretation as its new mascot in ASCII art style and serve as a rallying cry for Mozilla's mission".
With more than 475 glyphs, 150+ alternates, 12 ligatures and multilingual support, you can easily use this flexible font for any project from magazine covers to art posters. $8 1600 Premium, Customizable Infographics Templates. 8 instead of $30 – Get it now ! You’ll never need to worry about getting your point across again!
As businesses continue to divert their budgets toward content creation and digital marketing, so does the demand for marketing images, infographics, video content, social media marketing, packaging design and website design. Piktochart: creator of charts and infographics. Infographics. Animoto : video content creator.
Did you know that an incredibly powerful conversion design aspect lies in the art of typography? Marketing employs a wide range of design tactics to catch customer’s eyes, resonate, and leave a lasting impression. A marketer’s goal is conversion and they use every means possible to make that happen.
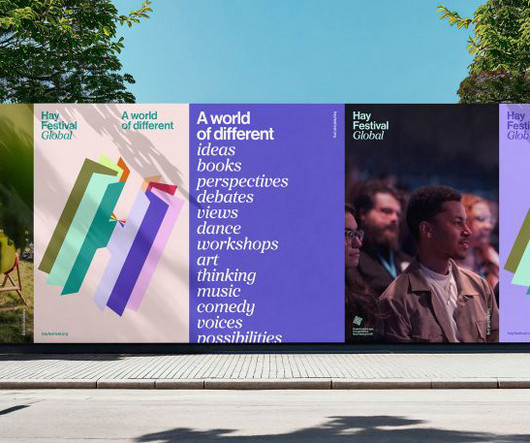
Previously known as the Hay Festival of Literature & Arts, the event was founded in 1988 and continues to be held annually in the book town of Hay-on-Wye, Powys, Wales, for ten days from May to June. Wider graphic assets within the identity, including infographics, agendas and social media posts, echo the logo design.
This section will explore different formats, such as chronological, functional, combination, and infographic resumes. Section 7: Utilizing Visual Elements To make your resume visually appealing, you can incorporate various visual elements such as icons, infographics, charts, and graphs.
Art Movement: While less common, the title could refer to an artistic movement that embraces asymmetry. Data visualizations, like interactive charts, infographics, and animated timelines, can transform dry data into compelling stories. The title could signify a growing appreciation for this approach.
Their team prides itself on providing an expert and friendly boutique service and supplying beautiful, eye-catching content to clients across all genres, including children's publishing, sci-fi and fantasy, concept art and character design. Categories covered include animation, illustration, mural art, sculpture and CGI.
You’ll also find a variety of templates for creating infographics and ad banners in minutes rather than hours. Upload your image, then add clip art, shapes, texts, and more in a matter of seconds. Infographics can present a lot of information in a compact design that’s easy to read and understand.
Image credits: Design cuts Brush slides, comprehensive infographic sets, service slides, team slides, portfolio slides—what more can you ask for? Are you looking to incorporate pixel-perfect illustrations and handcrafted Infographics in your presentation? Learn More 5. Learn More 11. Galaxi Keynote Template Galaxi Keynote Template.
It's more or less a work of art". Our storyboard for the film consisted of nearly 1,000 illustrated frames, including all complex ideas, infographics, charts, graphs, photo integration, camera moves and transitions. For us, a big payoff is in the comments on YouTube. But ultimately, we were happy when Ray saw the final product.
Art Deco Revival Art Deco Revival is like stepping into a Gatsby party but in the 21st century. We’re taking those classic Art Deco elements and giving them a modern spin. These are great for tables , charts, and infographics. Think clean lines , geometric shapes , and a touch of elegance.
Pinterest Pinterest is a platform that provides design inspiration and allows users to create and share visual bookmarks, or “pins,” on a range of topics, including art, design, and lifestyle. Free Infographic Tools: 66. Venngage Venngage is an online tool for creating infographics, reports, and data visualizations.
It is amazingly fitting for your use, including powerful slides, charming infographics, amazing photo layouts, cool colors, maps, Smart Art diagrams, and other features. . Searching for a contemporary design, the Space template is the ideal way to express yourself, your creativity, and your aesthetics.
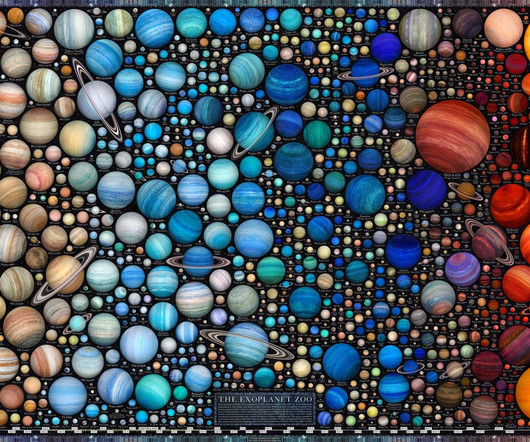
In his latest project, artist and author Martin Vargic turns that staggering number into a pair of striking infographics. Become a Colossal Member today and support independent arts publishing for as little as $5 per month.
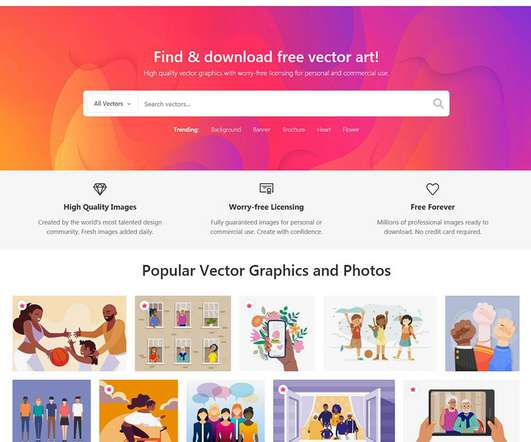
Using the website Vecteezy, you can easily access thousands of vector arts for free and utilize them for your work. All the arts are categorized in this resource so you can browse easily the one you desire for your project. Subtle Patterns. Also, in this site, the vectors are organized in categories to provide easy access. Vector EPS.
From Instagram-worthy infographics to Pinterest-perfect product photos, we'll teach you how to create eye-catching visuals that attract, engage, and inspire your target audience. Infographics: These visually appealing and informative graphics can break complex information or data into easily digestible, bite-sized pieces.
AI-Generated Art Have you played around with OpenAI’s DALL-E 2 yet? And with notable brands like Microsoft and Notion releasing their own design tools featuring built-in DALL-E integrations, you can bet we’ll only see more AI art in the new year. So why not take DALL-E 2 for a spin the next time you’re dreaming up creative assets?
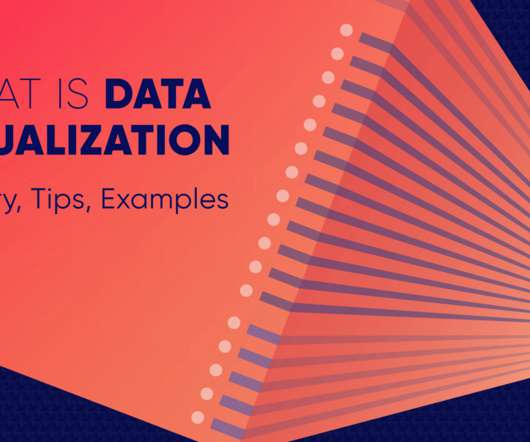
Learn how to create compelling infographics to visualize any kind of data. Infographics serve as the perfect bridge between data and understanding, offering a visual feast that not only educates but also engages. The Power of InfographicsInfographics are a dynamic medium that combines information, design, and storytelling.
Create mesmerizing visual art that ignites the imagination with the right tools! Adobe Illustrator Discover the ultimate vector graphics tool with Adobe Illustrator – the industry standard for professional logos, artwork, infographics, and icons. All are available through the Microsoft or Apple Store for a one-time purchase.
Discover more of the best Art Photography, Photography, Graphics, Infographics, and Conceptual Art inspiration on Designspiration Saved by Chad Tafolla (@chadtafolla).
Our handpicked selection includes fully editable vector art, illustrations, icons, graphic design templates, and background patterns. Free Infographics Bundle. Free infographics bundle by @Alexdndz. It’s hard to believe but you can also get this full infographics bundle for free! Free Download.
Let’s see some numbers: Content enriched with infographics gets 94% more views than articles without images. InfographicsInfographics represent a combination of images plus texts representing complex data or concepts distilled into easily readable graphics. Tweets (X Posts?) featuring images are twice as likely to be retweeted.
Download brush Flora Brushes 1 Experience the beauty of nature in your digital art with these 23 mid-sized flora brushes. Perfect for crafting realistic grass textures, they’re ideal for environmental scenes and nature-themed art. Perfect for digital designs and illustrations, it adds a vibrant greenery touch to your art.
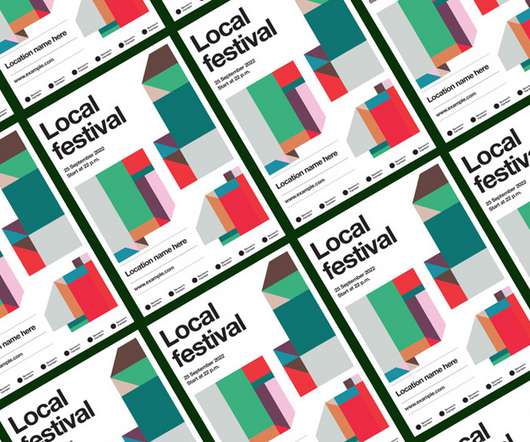
Whether art events or music festivals, the template is well suited for a wide range of topics. Thanks to the use of infographics, you can edit every single detail. Based on simple geometric shapes in various colors, the modern and minimalist layout will definitely cause a stir and will be remembered.
Think fashion, lifestyle, business, or art. Infographics: Present data in a visually appealing way. The template provides options for creating infographics. It’s like having a blueprint for your magazine. You can focus on content and customization. The template is designed to be versatile. It works for various genres.
Data Visualization VS Infographics: 5 Main Differences. Renting & Salary Statistics Infographic by Natalie Zuieva. Infographic Data Visualization by Madeline VanRemmen. Data Visualization VS Infographics. It is often you search for infographics and find images titled Data Visualization and the other way around.
Other than that, other factors come into play, like budget, the preferred scope, and even your general art style. Image credit: Visme Best animation software for basic infographics Platform: Windows, Linus, macOS (Operates Online) Pricing: US $29.00 Visme Visme. Crello Crello.
Alongside the showcases are a range of seminars, workshops and debates from the likes of Grey CCO Laura Jordan Bambach, Uncommon founder Nils Leonard, Pentagram’s Naresh Ramchandani and John Hegarty, who had an integral role in launching the New Blood programme in 1979.
AI-Generated Art + AI Video Have you played around with OpenAI’s DALL-E 2 yet? And with notable brands like Microsoft and Notion releasing their own design tools featuring built-in DALL-E integrations, you can bet we’ll only see more AI art in the new year. You can get in on this trend without knowing the blockchain inside and out.
Designed by Arterfak Project, it is a great font for modest themes like pop art, sci-fi, techno, and calmly-futuristic designs, among others. With its round cube cut and bold designs, Chipen is well-suited for technology, modern, and sci-fi-themed art projects. Download Now. Download Now. Descending – Glitch Design Elements.
Infographics are more than mere pie charts, histograms, or bar graphs. There are some rules that can be applied to any type of visual design, and infographics are no exception. In order to develop clear infographics, it’s also important to understand data relevance. Color Theory. This theory also applies to branding.
We organize all of the trending information in your field so you don't have to. Join 66,000+ users and stay up to date on the latest articles your peers are reading.
You know about us, now we want to get to know you!
Let's personalize your content
Let's get even more personalized
We recognize your account from another site in our network, please click 'Send Email' below to continue with verifying your account and setting a password.


Let's personalize your content